M. Kirm,1 G. Stryganyuk,2,3 S. Vielhauer,1 G. Zimmerer,2,3 V.N. Makhov,1,4*
B.Z. Malkin,5 O.V. Solovyev,5 R.Yu. Abdulsabirov,5 S.L. Korableva5
1 Institute of Physics, University of Tartu, Riia 142, Tartu 51014, Estonia
2 Institut für Experimentalphysik, University of Hamburg, Luruper Chaussee 149, 22761 Hamburg, Germany
3 HASYLAB at DESY
4 P.N. Lebedev Physical Institute, Leninskii Prospect 53, Moscow119991,Russia
5 Kazan State University, Kremlevskaya Str. 18, 420008 Kazan, Russia
Published in Phys. Rev. B 75, 075111 (2007)
Research on new optical materials is fundamental for the development of various applications, such as laser systems, plasma TVs, or new detectors for medical diagnosis. Many of these materials make use of ions of rare earth elements (RE), which can absorb and emit light in the ultraviolet and visible wavelength range efficiently.
In our work, we have focused on the luminescence and excitation properties of 5d-4f transitions of gadolinium (Gd3+) and lutetium (Lu3+) ions doped into different fluoride crystals using high-resolution spectroscopy. We could analyze the excitation spectra using model calculations, and assign the fine structure observed in the spectra to different mechanisms. We regarded both pure electronic transitions within the RE ions and phonon-assisted transitions, in which the excited ions interact with the crystal lattice. While the 5d-4f transition energies in Gd3+ and Lu3+ are too high for current technical applications, our calculations for the 5d absorption bands are applicable to various combinations of host crystals and RE ions. This may be beneficial for the development of new optical materials based on RE3+ centres.
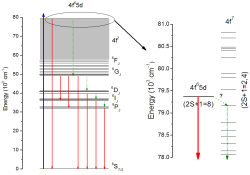
Figure 1: Simplified energy level scheme for the 4f7 and the lowest 4f65d states of Gd3+ (left side). Blue arrows indicate excitation by VUV radiation, green arrows (non-radiative) relaxation, and red arrows the observed luminescence. The shaded area covers a range with many closely spaced f-levels, which cannot be distinguished in this scale. Right side: 4f7 levels in the energy range of the emitting 4f65d state. Non-radiative transitions (intersystem crossing) between 5d and 4f states are heavily spin-forbidden. Energies according to H. M. Crosswhite et al., J. Chem. Phys. 50, 5032 (1969).
Trivalent rare earth ions play a crucial role in many optical materials, from laser crystals and scintillators to phosphors in fluorescence lamps. Characteristic for the RE3+ ions are the numerous 4f states, which are only weakly coupled to the lattice, as they are shielded by the outer 5s and 5p orbitals. In optical spectroscopy, the 4f states are observed as narrow-line structures. At higher photon energies, 5d states can be excited, which have stronger coupling to the lattice. The 5d states are usually characterized by broader bands in the spectra.
Up to recently, luminescence from trivalent rear earth ions (RE3+) in the vacuum ultraviolet (VUV) has been detected only from Nd3+, Er3+, and Tm3+. However, our studies have shown that VUV 5d-4f luminescence (hν ~ 10 eV) is also observed from Gd3+ and Lu3+ ions doped into some fluoride hosts with sufficiently wide energy band gaps [1-4]. The observation of 5d–4f luminescence from the Gd3+ ion is rather unexpected because of the considerable number of closely spaced 4f7 levels in the same energy region as the 4f65d states, which should enable relaxation from the lowest Gd3+ 4f 65d level to lower-lying 4f7 levels (Fig. 1) [5]. However, at low temperatures a rather intense VUV luminescence has been detected from several materials containing Gd3+ ions. The situation is different for the Lu3+ ion, which has only a single ground level of the fully occupied 4f14 electronic configuration. The reason why Lu3+ 5d–4f luminescence has never been detected earlier may arise from the fact that the corresponding photon energy is the highest among all RE3+ ions.
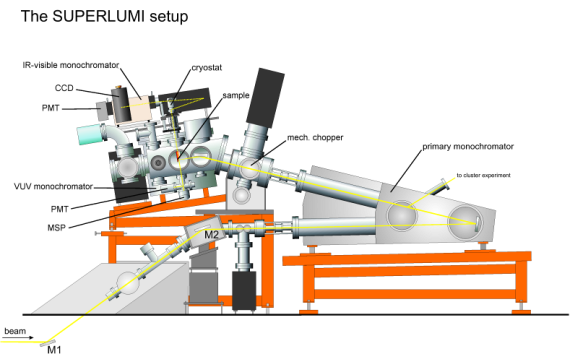
The experiments were performed at the SUPERLUMI setup (Beamline I) of the DORIS storage ring (Fig. 2) [6]. The 2-m primary monochromator in normal incidence mounting allows excitation in the range 4-40 eV with resolutions up to 0.3 Å [7]. High-resolution luminescence spectra were recorded using a 1-m McPherson normal incidence monochromator with a position sensitive micro-channel plate detector. In second order, a resolution of 0.5 Å was achieved. The samples were mounted on a helium cryostat, covering temperatures in the range 4-400 K. Both single crystals and powder samples of various Gd and Lu containing fluorides were used for the measurements. All experiments were carried out under UHV conditions.
Figure 2: Front view of the SUPERLUMI setup at beamline I of DORIS III at DESY. The beamline is equipped with a 2-m normal incidence primary monochromator for the VUV range, and three secondary monochromators to detect luminescence from the VUV to IR spectral range. The 1-m high-resolution monochromator used for emission spectra measurements in the VUV is not shown, it is mounted behind the vacuum chambers at 90º angle from the exciting beam.
In our publication, we present the results of a detailed investigation and characterization of VUV luminescence due to 5d–4f transitions in Gd3+ and Lu3+ ions in several fluorides. In addition to high-resolution luminescence spectra, high-resolution excitation spectra have been measured as well, allowing the detailed analysis of the electron-phonon coupling. For comparison purposes, the Ce3+ ion with its simple electronic configuration, doped into the LiGdF4 host, has been included into our investigation (Fig. 3).
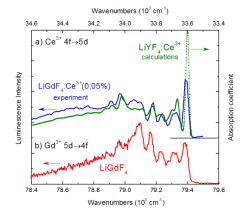
High-resolution emission spectra for Gd3+ 5d-4f transitions in LiGdF4 are displayed in Figure 3 (b), together with 4f-5d excitation spectra of Ce3+ doped into LiGdF4 (a), which was shifted and inverted on the energy scale. The presence of narrow zero-phonon lines and vibronics in combination with broad side-bands indicates that for this matrix the electron-phonon coupling for the lowest 5d state is of intermediate strength (Huang-Rhys factor S ~ 1). The fine structure in both spectra matches astonishingly well. In addition, a calculated absorption curve for LiYF4 doped with Ce3+ is given [8]. Again, all major peaks of the spectra are reproduced, confirming our assignment of the fine structure to phonon-assisted transitions.
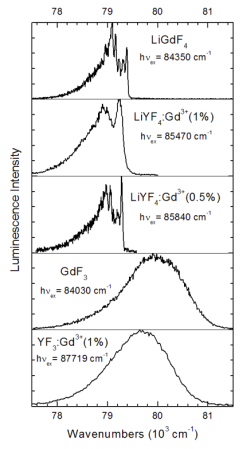
Fig. 4 shows high-resolution emission spectra due to the Gd3+ 5d-4f transition in various Gd3+ containing matrices, measured at T = 10 K. In all cases, luminescence is thermally quenched at temperatures above 200 K. While the upper spectra of LiGdF4 and LiYF4:Gd3+ are richly structured with a series of distinct lines, the spectra of GdF3 and YF3:Gd3+ show nearly featureless emission bands. For the last two compounds, a strong coupling of Gd3+ ion and the lattice exists (expressed by a Huang-Rhys factor S > 5), which leads to the absence of fine structure in the spectra.
|
Figure 3: Comparison of phonon structure in the spectra of 5d-4f transitions of Gd3+ and Ce3+ in the LiGdF4 matrix. Part (a) shows a high resolution excitation spectrum of LiGdF4:Ce3+ (blue, upper wave number scale), and the calculated absorption spectrum for Ce3+ 4f-5d transitions in LiYF4 (green, upper wave number scale). (b) High resolution emission spectrum for LiGdF4 (red, lower wave number scale). Both the Ce3+ excitation and the Gd3+ emission spectra show nearly identical features, indicating that the phonon coupling to the lattice is responsible for the observed fine structure. |
Figure 4: High-resolution VUV emission spectra (0.8 Å resolution) of various Gd3+ containing compounds, measured at T = 10 K. The three upper spectra show cases of intermediate coupling of the 5d states with the lattice, zero-phonon lines and different vibronics can be observed for this case. For GdF3 and YF3 doped with Gd3+, the coupling is stronger, resulting in broader and featureless emission bands. |
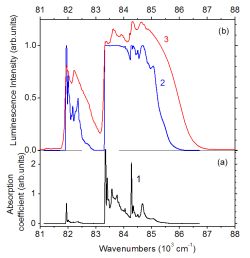
Figure 5: (a) Calculated Lu3+ 4f – 5d spin-allowed absorption spectrum (1, black curve). (b) Model curve for the excitation spectrum (2, blue line) created from the calculated absorption, and measured low temperature excitation spectrum (3, red curve) for LiYF4:Lu3+ (5%).
A comparison of calculated and measured spectra of Lu3+ doped into LiYF4 is shown in Fig. 5. A direct comparison of the absorption spectrum obtained from theoretical calculations (1) with the measured excitation spectrum (3) does not yield satisfactory results. Only after modelling excitation spectrum (2) from absorption curve K(Ω) by approximating 1-exp[-K(Ω) d] (d: thickness of the sample), the experimental curve can be approximated. There are still various incongruities, especially on the high-energy side of the excitation bands, but the fine structure for the 4f-5d transitions is well reproduced within the limits of the current model.
In conclusion, we have shown that 5d-4f emission from Gd3+ and Lu3+ incorporated into some fluoride crystals can be observed at low temperatures. Both emission and excitation spectra show a rich fine structure, which can be described in a framework of electron-phonon coupling for the 5d states. The combination of high-resolution VUV spectroscopy and theoretical modelling using the real vibrational spectrum of the crystal lattice allows a detailed analysis of Gd3+ and Lu3+ 5d excitations in various fluoride-type hosts. With our theoretical model, the 5d absorption band structure can be determined for various combinations of RE ions for a given host material without need for additional experimental data. We hope therefore that calculations based on our model will be useful in the development on new optical materials based on RE3+ transitions.
Acknowledgements
The authors would like to thank J.Y. Gesland and J.C. Krupa for supplying us with some of the investigated samples. The support by RFBR Grant 05-02-17306, by Estonian Science Foundation (grant no. 6538), by Ministry of education and science of Russian Federation (project RNP 2.1.1.7348) and by European Community Research Infrastructure Action within the FP6 Program (Contract RII3-CT-2004-506008 (IA-SFS)) is gratefully acknowledged.
|
References |
Contact information |
|
[1] M. Kirm et al., Phys. Rev. B 70, 241101(R) (2004). |
Vladimir N. Makhov (*corresponding author) |
| Further Information |
 Download Paper (313KB) Download Paper (313KB)
Copyright 2007© by The American Physical Society. All rights reserved.
|


