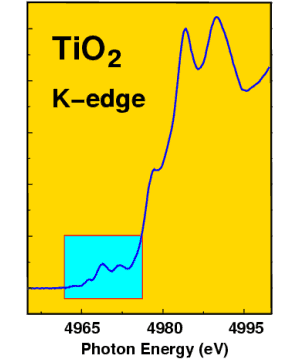
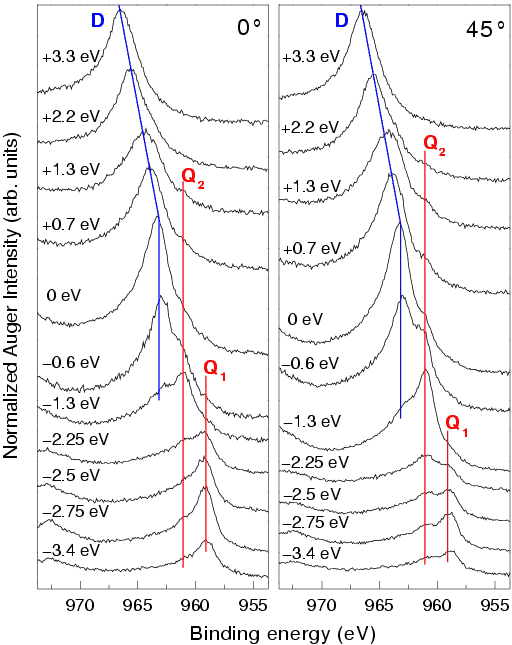
Fig. 1. Ti KL2L3 (1D2) Auger line for the indicated different photon energies recorded in the 0° (left part) and the 45° (right part) geometries. The spectra are shown on a binding energy scale. The Auger line is observed to split into three components near threshold, labeled Q1, Q2, and D, which exhibit a distinctly different resonance modulation.
J. Danger1,2,3, P. Le Fèvre1, H. Magnan3, D. Chandesris1, J. Jupille4, S. Bourgeois5, T. Eickhoff6 and W. Drube7
1 Laboratoire pour l?Utilisation du Rayonnement Electromagnétique, CNRS-Université Paris Sud, Bât. 209d, BP 34, 91898 Orsay, FRANCE.
2 Institut de Physique et Chimie des Matériaux et des Surfaces, CNRS-Université Louis Pasteur, 67037 Strasbourg, FRANCE.
3 Service de Physique et Chimie des Surfaces et Interfaces, Commissariat à l'Energie Atomique, 91191 Gif sur Yvette, FRANCE.
4 Groupe de Physique des Solides, CNRS-Université Paris VI et Paris VII, Tour 23, 2 place Jussieu, 75251, Paris, FRANCE.
5 Laboratoire de Recherche sur la Réactivité des Solides, CNRS-Université de Bourgogne, BP 47870, 21078 Dijon, FRANCE.
6 Institut für Experimentalphysik, Universität Hamburg, 22761 Hamburg, GERMANY.
7 Hamburger Synchrotronstrahlungslabor am Deutschen Elektronen-Synchrotron DESY, 22603 Hamburg, GERMANY.
Published in: Phys. Rev. Lett. 88, 243001, June 17, 2002
Quadrupolar transitions can play an important role in X-ray absorption spectroscopy, especially when it is used for magnetic measurements, like in X-ray Magnetic Circular Dichroism or Resonant Magnetic Scattering. We show here that resonantly excited Ti KL2,3L2,3 Auger spectra of TiO2(110) carry a clear signature of quadrupolar transitions from the 1s to localized eg and t2g d-like states. The quadrupolar nature of the observed additional spectator lines are clearly demonstrated by their angular dependence, and their intensity is used to locate and quantify the quadrupolar transitions in the absorption spectrum.
Since it obeys strict selection rules, X-ray absorption (XAS) is an element and orbital-selective probe of both crystallographic and electronic structure of materials. Beyond the dominant features of the absorption spectra arising from excitations which can be interpreted within the dipolar approximation, the absorption pre-edge and near-edge features commonly involve second order quadrupolar transitions (QT) [1]. Although these are of weak intensity, their corresponding terms in the interaction Hamiltonian often contain valuable informations. For instance, they can be predominant in X-ray Magnetic Circular Dichroism measurements at the L2,3 edges of rare earths [2] or in Resonant X-ray Magnetic Scattering, both at the L2,3 edges of rare earths [3] or near pre-K-edge features of 3d compounds [4]. Associated to transitions to p and d orbitals [5], these pre-peaks involve both dipolar and quadrupolar transitions and are also important in magnetic measurements [4]. A picture of the occurrence of QT is therefore of prime interest to achieve a description of the electronic structure of these compounds and to fully account for their physical properties. A common way to discriminate dipolar and quadrupolar transitions is based on the interpretation of the angular dependence of the XAS cross section, since the electric dipolar (ε.r) and quadrupolar (ε.r k.r) terms of the interaction hamiltonian are sensitive either to the polarization direction e of the X-rays or to both ε and the direction of the photon wave vector k [6]. However, this method suffers from severe drawbacks. It can only be applied to single crystals and, to insure that the weak quadrupolar contributions can be distinguished from the more intense dipolar components, its use is restricted to the study of pre-edge features well separate from the main absorption threshold. Moreover, it does not discriminate the different contributions. Resonant Auger spectroscopy permits to overcome those limitations. It consists in observing an Auger decay while scanning the photon energy through an absorption edge. Due to the presence of a core photoexcited electron in a localized empty orbital, additional decay lines, so-called spectator lines [7], appear at constant binding energies and at higher kinetic energies than the classical decay. In this work, the capability of the method to resolve quadrupolar and dipolar contributions is illustrated by solving the long debated question of the pre-K-edge of titanium in rutile TiO2 [8,9] and by discriminating the various components its features in good agreement with theoretical predictions [9,10].
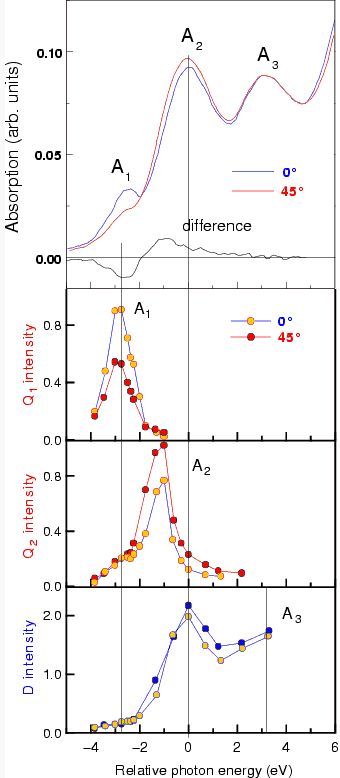
The experiments were performed at the BW2 wiggler beamline of HASYLAB, equipped with Si(220) crystals monochromator. Data were collected on a TiO2(110) rutile single-crystal, prepared according to standard procedures in order to obtain the stoichiometric composition [11], and the angular dependence was studied by rotating the sample around a vertical axis. The electron collection direction is fixed in the horizontal plane at 45° from the incoming X-ray beam. The Ti K-edge XAS spectrum (see top of Fig.2) exhibits a series of three pre-peaks labeled A1, A2 and A3. In the following, the photon energy is referenced relative to the maximum of A2 whose absolute energy position was measured to be 4968.9 eV. A1 and A3 are thus peaking at -2.75 eV and +3.0 eV relative photon energy, respectively. Total electron yield spectra were recorded for two different X-ray incidence angles with respect to the (110) surface. The wave vector of the X-rays is either parallel to the (110)-surface normal (0°, ε at 45° from the a axis), or at 45° from it (45°, ε parallel to the a axis). At a K-edge, the dipolar transition probability is not expected to vary [1], while, on the contrary, quadrupolar contributions are expected to have the largest possible intensity variation between 0° and 45°, since the d symmetry of the probed orbitals confers to their intensity a cos(4Φ) dependence (where Φ describes the rotation of ε and k in the (100) plane).
All the angular dependences are therefore due to intensity variations of QT. In rutile, the first coordination shell of Ti atoms is composed of 6 oxygen atoms which form a distorted octahedron [8]. The 3d levels are split by the crystal field into t2g and eg orbitals, pointing between or towards the O neighbors, respectiviely. Using the electric quadrupolar hamiltonian formula, one can easily demonstrate that the maximum intensity at 0° and the minimum at 45° of the A1 pre-peak are indicative of QT towards t2g-like orbitals. The reversed behavior of A2 shows that its quadrupolar component is mostly eg-like, while the absence of any angular dependence of A3 is assigned to a purely dipolar origin [10]. The data meet the previously published results [8,9]. However, these did not allow an experimental decomposition of the pre-edge into its various quadrupolar and dipolar contributions. In this goal, an analysis of the Ti KL2,3L2,3 resonant Auger lines was undertaken in the pre-edge region of the Ti K-edge. In the following, we will concentrate on the main 1D2 line of the normal Auger spectrum which is the most intense. Spectra collected in both 45° and 0° geometries are shown in Fig.1. The series of resonant 1D2 Auger spectra exhibit three components, labeled Q1, Q2 and D whose intensity strongly varies with photon energy. Q1 and Q2 both appear at constant binding energy (959.1 and 961.1 eV, respectively), while D has a different behavior. It first appears at a constant binding energy of 963.2 eV (Raman-Auger behavior), until it reaches the position of the 1D2 Auger peak at a constant kinetic energy of 4006.3 eV. The Auger spectra were then assumed to be a simple sum of these three components using Lorentzian lineshapes and an integral background. The intensities determined from this analysis are presented in Fig.2. Q1 has a maximum intensity close to the maximum of the A1 pre-peak (-2.75 eV) and follows the same angular dependence. Considering both resonant behavior and angular dependence, Q1 is assigned to an Auger decay following the quadrupolar excitation of a 1s electron in the t2g-like orbitals. Moreover, since it appears at constant binding energy, it can be identified as a spectator line. The intensity of Q2 shows a maximum just below A2 (-1.0 eV) roughly where the difference between the two XAS spectra recorded at 0° and 45° is maximum (Fig.2). Unlike Q1, it increases from 0 to 45°, and can therefore be attributed to a spectator line due an additional valence electron promoted in the eg-like orbitals via a QT. Last, peak D is attributed to decay following a dipolar transition of the 1s electron towards the p empty states of continuum, since it finally stabilizes at the position of the classical Auger line. Consistently, its intensity does not show any significant angular variation (bottom of Fig.2). Assuming equal Auger decay rates for the different intermediate states, this intensity analysis of the different Auger components gives an estimate for the relative contributions of quadrupolar and dipolar transitions in the pre-peaks. Thus, A1 has a purely quadrupolar origin, A3 is purely dipolar; a quadrupolar contribution to A2 is detected on its low photon energy side. All these results are in agreement with the calculations presented in ref. 9.
The intensity variation of Q1 (respectively Q2) with the X-ray incidence angle mimics the angular dependence of A1 (A2) in the absorption measurements and possesses the cos(Φ) dependence expected from the electric quadrupolar hamiltonian. The clear determination of the eg and t2g quadrupolar components also allows a precise measurement of crystal field splitting between these two levels, given by the photon energy difference between the resonance positions of Q1 and Q2 (1.75 eV). Since the coulomb interaction between the 3d levels and the 1s core hole are weak, the so-called "10Dq" value can be directly extracted from the experimental results, while it is more complicated at the L2,3 edges [12].
In conclusion, for the Ti K-edge region in TiO2, the resonant behavior of the KLL Auger lines has been used to unravel the different contributions to the absorption spectra. Raman Auger lines following dipolar excitation towards p states, and spectator lines following QT towards eg and t2g states, split by fine crystal field effects, are clearly discriminated. These decays are unambigously identified by analyzing their resonant energy and their angular dependence. An estimate of the t2g - eg splitting is directly obtained. Therefore, resonant Auger spectra offer direct and separate fingerprints for the different transitions occurring in the studied absorption edge, either to the continuum, or to bound states, like, e.g., quadrupolar transitions to d states at K-edges. As an experimental method to bring QT to the fore, resonant Auger is certainly more efficient than angular dependent XAS, which only allows to vary the relative weights of dipole and quadrupole contributions in the unselective mixture of the absorption signal. These two contributions are clearly separated in the Auger spectra, so that their energy position and intensity allow an identification of the QT not only in resolved absorption pre-peaks. Next, angular XAS can only be performed on single crystals, whereas resonant Auger measurements can be carried out on powders or amorphous materials. In this case, the angular analysis would be pointless (left and right sides of Fig.1 would be the same), but same Raman and spectator lines will be observed since they are purely due to the local electronic structure. Angular XAS relies on the orientation of the electronic orbitals with respect to the axis of the infinite and periodic crystallographic structure, whereas resonant Auger measurements is a real selective and local probe of the near Fermi level empty orbitals, provided they are localized enough. Last, the sensitivity of electron spectroscopy to the first atomic planes also opens new prospects to evidence differences of the electronic structure near the surface.
This work was supported by the E.U. program for access to large facilities. We thank H. Schulte-Schrepping and J. Heuer for implementing the (220) monochromator.
| References |
|
[1] C. Brouder, J. Phys.: Condens. Matter2, 701 (1990) |
| Contact information |
|
Patrick Le Fevre |
| Further Information |


