Figure 2: Cobalt determined using MXRF from a double line of Cobalt spots dried from a 0.01 g/L Co Std. solution delivered by a HP DeskJet 500C on Ultralene foil, a) distribution of cobalt on the foil (in cps of the Kα line of Co) superimposed by 300 dpi grid to show the resolution of the printer b) intensity profile of cobalt Kα-line from the section marked in (2a)
Ursula E. A. Fittschen1, Nicolas H. Bings1, Stephan Hauschild1, Stephan Förster1, Arne F. Kiera1, Ezer Karavani1,2, Andreas Frömsdorf1, Julian Thiele1, Gerald Falkenberg3
1Chemistry Department, University of Hamburg, Martin-Luther-King Pz. 6, 20146 Hamburg, Germany
2 Department of Biotechnology Engineering, Ben Gurion University,Beer Sheva, Israel
3 Hamburger Synchrotronstrahlungslabor at Deutsches Elektronen-Synchrotron DESY, Notkestrasse 85, 22603 Hamburg, Germany
Published as: U.E.A. Fittschen et al., Anal. Chem. (2008), 80, 1967-1977
Nowadays microscopic analysing techniques are easily capable of resolution of a few micrometers and beyond. The accuracy of the techniques rely on the comparison to standard reference material. However, reference materials which are homogeneous on the micrometer-scale are often not available or tedious to prepare. In contrast the preparation of dried residues derived from pico liter volumes using thermal ink jet printing technology discussed and characterized in this study is very simple and has the potential to become accessible to a wide variety of laboratories and may become wide spread in analytical science in the future.
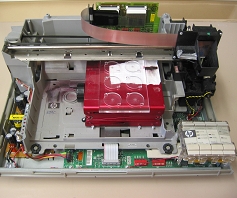
In this paper we characterized the dried residues of pico liter droplets (ca. 130 pL) prepared by a slightly modified ink jet printer HP DeskJet 500C. The characterization was focused on the reproducibility of dosing elemental amounts, size and shape of the dried residues. Additionally we showed the potential of this technique for direct LA-ICP-TOFMS analysis.
In recent years the direct analysis of solid samples gained importance to solve scientific questions where sample amounts are limited. This applies for analysis of biological samples like tissue sections or proteins and environmental studies on aerosols. Analytical techniques using micro and even nano beams like micro proton induced X-ray emission (mPIXE)1, electron micro probe analysis (EMPA)2,3 , micro X-ray fluorescence (MXRF)4,5 and laser related methods like laser ablation inductively coupled plasma mass spectrometry (LA-ICP MS)6 has been applied to extract information on elemental composition and amounts from very small sample volumes (µm3). These microscopic techniques have become powerful tools for two or even three dimensional elemental mapping7,8 , high throughput screenings9 and elemental determination in minute amount of samples like single particles10,11,12,13 or single cells14. Although numerous successful applications of these techniques have been reported, suitable reference material that covers the different demands on elemental composition and concentrations is often lacking. For elemental mapping a homogeneous reference like foils or plates covered with one or more elements has been applied successfully in MXRF analysis15,16. In these studies concentration of the reference was related to that of the sample. If the absolute amounts of elements in minute amounts of samples like single cells or single particles have to be addressed, a small reference well defined in size and shape and having an elemental composition that can be custom made for the analytical question would be favourable. In this case the absolute elemental amount delivered by the reference is related to that of the sample. For this calibration strategy the examination of the whole sample and the whole reference is of utmost importance, which has been shown for dried residues of ink droplets (117 µm diameter) in mPIXE analysis17. Matrix-matched calibration techniques, i.e. the combination of continuous nebulization of standard solutions with LA of the solid sample material, are well known in LA-ICP MS18,19,20,21 (precision ca. 3-25%) and are especially helpful when solid reference material is lacking which normally provides a precision of ca. 10%. However, if the absolute mass of sample material ablated by individual laser pulses has to be quantified, benefits of this strategy are limited, for example in the case of quantitative elemental analysis of minute amounts of solid sample, such as individual particles. In neither of the reported cases dried residues of known elemental mass were used as calibration standards for mass spectrometric analysis of solid samples.
In this study we introduce dried residues of pico droplets generated by inkjet printers as reference for micro beam analysing techniques like LA-ICP-TOFMS. Precisions from 4-25% were achieved in this study with a great potential for further optimization to lower than 10%.
Dosing
TXRF was used to quantify the total amount of material deposited by the printing of standard solutions over a large area using a selected number of droplets. The number of droplets was used to determine the amount of material deposited by each individual droplet. The standard deviations were found to be between 3 and 15 % and correlation coefficients of the curves to be between 0.925 and 0.9997 depending on the different studies.
The precision of the described dosing procedure was determined through the relative standard deviation from the analysis of individual residues of dried droplets studied by MXRF. The elemental distribution was mapped with a polycapillary with a focal spot size of 15 µm (FWHM) at the MXRF set up at beamline L at HASYLAB.
The results from the 0.01 g/L cobalt solution are given in Fig. 2 a) and b). In Fig. 2 a) a raster showing the resolution of the printer from 300 dpi was displayed additionally to the Co distribution image. It can be seen that the precision for spotting a standard on a certain place is determined by the resolution of the printer. The standard deviation of the count rate obtained from the individual dried residues was found to be 6 %. The same experiment using a 1 g/L cobalt solution an even lower standard deviation of 4 % was obtained.
Size
Micro analytical techniques can profit from small well defined elemental deposits. Therefore the size of the dried residues of the pico droplets is very important.
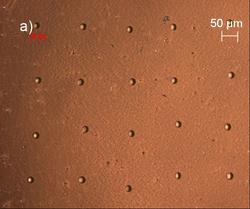
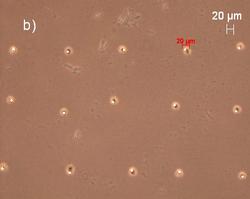
The diameters of the dried residues were studied using a light microscope. Depending on the concentration of the sample solution and the substrate (Fig. 3), the diameters range between 5 µm and 20 µm for 1.5 pg and 174 pg, delivered respectively. The size of the pico droplets strongly depends on the interaction at the liquid/solid interface22
Shape
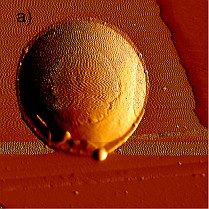
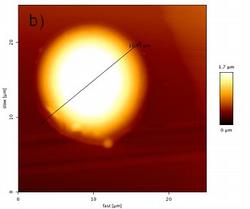
Figure 4c: Heights profile of the dried residue from a 146 pL droplet of a 1 g/L Fe standard solution determined using AFM
The absorption effects in MXRF and the volume that has to be volatilized by the laser were estimated from the shape of the dried residues. The shape was studied using atomic force microscopy.
As AFM studies on nanoliter droplets delivering 200pg revealed that these droplets dried mostly to give ring-like residues23, it was important to check if that would still apply if the delivered volume is reduced by one order of magnitude. The AFM analysis of a 3 x 3 pattern of dried residues from 150 pL of a 1 g/L Fe(III) standard solution spotted on acrylic glass carriers revealed that these dry to give symmetrical spherical segments with a diameter of 17 ± 3 µm and a height of 1.7 ± 0.3 µm. The phase image of one of the dried residues is shown in Fig. 4 and the heights profile is shown in Fig. 4c.
Applicability for LA-ICP MS
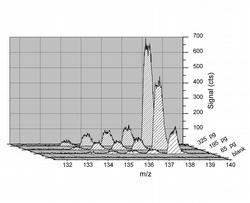
Figure 5: Peak area measurement of transient signals for Ba isotopes resulting from LA of dried droplets containing 65 pg, 195 pg and 325 pg of Ba combined with ICP-TOFMS detection
Laser ablation in combination with plasma source mass spectrometry (LA-ICP MS) has evolved to a mature tool in the field of elemental analysis of solid samples. Its advantages are manifold, since complex sample preparation steps are seldom necessary, which can result in high sample throughput even in the case of refractory materials24,25. Also it enables three-dimensional visualization of elemental distributions in solid samples with high spatial resolution26,27.
Nonetheless, accurate calibration in laser ablation is often difficult, since it is hampered by elemental fractionation and the lack of available standard reference materials28,29. The homogeneity of the calibration standards is of additional importance30, which gains significance with decreasing amount of sampled analyte mass, e.g. when performing single-shot LA31,32,33 for the analysis of precious samples or the characterization of individual aerosol particles.
An improved strategy is based on the correlation of the transient signal in LA-ICP MS originating from the sample material, with such a signal resulting from the complete ablation of a known amount of standard material. The latter can be performed through the ablation of dried residues from small droplets with known volume of standard solutions, which not have been done before.
Different reference material were prepared through single- and two-element standard solutions onto acrylic glass carriers, using a 1 g/L Ga, and a 0.5 g/L Ti and Ba solution. The transferred sample mass was 130 pg, 390 pg and 650 pg for Ga and 65 pg, 195 pg and 325 pg for Ti and Ba, respectively. To minimize the diameter of the residues, the droplets were allowed to dry for one minute before printing the next droplet on top of the first layer.
Integration of the complete transient signals caused by the ablation of dried droplets containing 65 pg, 195 pg and 325 pg of Ba leads to signals, which are shown in Fig. 5.
Table 1 Achievable precision (14 replicates) using multiple layer printing of picoliter droplets of single-element (1 g/L Ga) and two-element (Ti and Ba, each 0.5 g/L) solutions combined with LA and ICP-TOFMS detection.
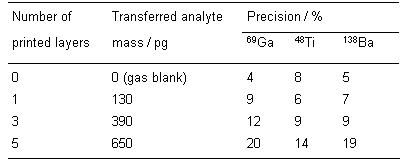
It can be concluded from Table 1, that for both single- and two-element standards the achievable relative standard deviation for LA of dried-droplets in combination with ICP-TOFMS detection increases significantly with deposited sample mass to values of up to 20 %.
Considering the ablated minimum sample masses, good correlation can be achieved for the investigated isotopes, resulting in R2 values of 0.9959 for 69Ga, 0.9974 for 138Ba and 0.9748 for 48Ti. The relative standard deviations increasing with sample mass were found to be related to insufficient precision in congruently printing the different droplet layers. But still the easiest way to improve precision would be to use single layer printing of different concentrations of single- or multielement standard solutions. Both topics are subject to ongoing studies in our laboratory.
Acknowledgments
The authors acknowledge Angela Schlenker for her assistance during ICP-TOFMS measurements.
|
References |
||||||||||||||||||||||||||||||||||||||||||||||||||||||||||||||||||
|
||||||||||||||||||||||||||||||||||||||||||||||||||||||||||||||||||
|
Contact information |
||||||||||||||||||||||||||||||||||||||||||||||||||||||||||||||||||
|
Dr. Ursula Elisabeth Adriane Fittschen |
||||||||||||||||||||||||||||||||||||||||||||||||||||||||||||||||||
| Further Information |


