


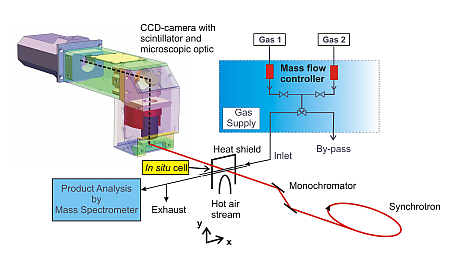
Figure 1: Strategy of the experiment for 2D-mapping of samples in the μm-scale.
(1) The transmitted intensity is recorded by a CCD-camera as function of the energy, and the position (x,y).
(2) The X-ray energy is varied using a double crystal Si(311) monochromator.
(3) The catalytic experiment is performed in an X-ray transmittant microreactor equipped with gas supply system and a mass spectrometer for determining the catalytic performance.
J.-D. Grunwaldt1, St. Hannemann1, Ch. G. Schroer2,3, A. Baiker1
1Department of Chemistry and Applied Biosciences, ETH Zurich, CH-8093 Zurich
2HASYLAB at DESY, Notkestrasse 85, D-22607 Hamburg
3Present address: Institut für Strukturphysik, TU Dresden, D-01062 Dresden, Germany
Published as: J.-D. Grunwaldt et al., J. of Phys. Chem. B 110, 8674 (2006)
Structure-activity relationships gained by studying catalysts at work are considered the key to further development of homogeneous and heterogeneous catalysts. In situ X-ray absorption spectroscopy (XAS) is a well-established technique to study catalytic reactions, since it can monitor chemical states of both crystalline and X-ray amorphous structures even in gas phase, liquid phase or at high pressure. However, spatial variation of the structure within a catalytic reactor has hardly been investigated up to now. Here, we report on 2D-mapping of the structure of a heterogeneous catalyst using an X-ray camera for acquisition of X-ray absorption images. As title reaction, the partial oxidation of methane over Rh/Al2O3 was studied, which is a promising reaction for the production of hydrogen from natural gas. The X-ray camera was installed behind the microreactor and 170 X-ray absorption images were taken around the Rh K-edge. This allowed reconstructing the full Rh K-edge XANES spectra at each location in the reactor. The results uncovered tremendous changes of the structure of the Rh particles along the catalyst bed within less than 100 μm. The method applied should also be suitable for spatially resolved structural investigations in other areas such as materials science, environmental science, electrocatalysis, and sensor technology.
Introduction
X-ray absorption spectroscopy in terms of X-ray absorption near edge structure (XANES) and extended X-ray absorption fine structure (EXAFS) has been widely used to study catalysts in gas phase, liquid phase or even at high pressure (cf. (1-7) and references therein). Despite the growing number of publications on in situ studies for identifying active sites in catalysts, spatial variation of the active site structure within the catalytic reactor has hardly been investigated up to now. Such in situ molecular information on a micro-scale is of substantial importance, for example, if the gas composition or the temperature strongly changes along the catalyst bed as encountered in partial oxidation reactions and catalytic combustion.
Principally, two different approaches can be chosen for 2D-imaging. Third generation synchrotron radiation sources in combination with lenses or KB-mirrors (Kirkpatrick-Baez geometry) can provide highly focused hard X-ray beams which allow absorption spectroscopic scanning of the sample. This technique has been applied in environmental science, material science, biology, etc. (8-12) and will also be available at the X-ray absorption beamline at PETRA III in future (13). On the other hand 2D-area detectors give the possibility to record locally resolved the intensity behind the sample (14). The latter method has been selected in the present study, since the parallel data acquisition leads to shorter recording times, important in case of in situ studies.
The technique and its potential are demonstrated using partial methane oxidation over Rh/Al2O3 as an example. Catalytic partial oxidation of methane over supported noble metal particles is regarded one of the most promising processes for hydrogen production and gas-to-liquid technologies, particularly in chemical plants of medium size (15-17). Rhodium is unique for its high resistance against carbon formation (18) and was thus chosen for the present study. Previous in situ infrared spectroscopy and extended X-ray absorption fine structure (EXAFS) studies have shown considerable structural changes of the Rh particles under reaction conditions (18, 19). Moreover, it is speculated that in the first part of the reactor the catalytic oxidation of methane and in the second part methane reforming is prevalent. This should have important implications on the catalyst structure along the catalyst bed, as e.g. predicted by modeling (20) and IR thermography studies (18). It is thus a well-suited system to study the spatial variation of the catalyst structure inside a catalytic reactor at work.
Strategy of the experiment
Figure 1 gives an overview of the experimental strategy. The experiments were performed at beamline X1 at HASYLAB and the setup consisted of a CCD camera and a microreactor (containing 2.5wt%Rh/Al2O3, in a glass capillary, cf. refs. (21, 22)), a gas supply system to provide the 6%CH4/3%O2/He reaction mixture, and a mass spectrometer for on-line gas analysis. The incoming I0(E, x, y) and transmitted intensity I(E, x, y) was measured by moving the microreactor out of and into the beam, respectively, at each of the x-ray energies in the XANES region around the Rh K-edge (from E = 23190 to E = 23375 eV in steps of one eV). The exposure time for each image was 30 s.
From these data, the absorption along the optical axis can be obtained for each pixel. After correction, each pixel value is proportional to the intensity I(E, x, y) and I0(E, x, y) for images taken with or without sample, respectively. In addition, “integral” spectra (averaged over the whole in situ cell) were taken using an ionization chamber before and behind the spectroscopic cell when dynamic changes of the gas flow conditions or the temperature were applied.
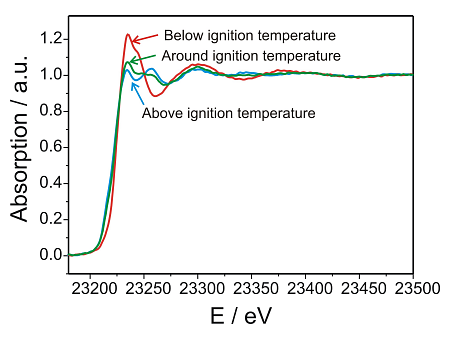
“Integral” XANES spectra at the Rh K-edge during the ignition of the reaction
At first, spectra over the whole reactor bed were recorded at room temperature, then during heating to 400 °C (Figure 2). The integral spectra unraveled the rapid reduction of the Rh/Al2O3 catalyst during ignition of the partial oxidation reaction, which is in line with our previous results (19, 23). Only as a short intermediate a partly reduced Rh-catalyst was observed in these integral spectra. During cooling and heating cycles, the oxidation and reduction was observed to be reversible. The traces in the on-line mass spectrometer analysis revealed that at the moment of the ignition of the partial oxidation reaction at about 330 °C the Rh-particles were reduced. Hence, the (partial) reduction of the Rh/Al2O3 catalyst was accompanied by the appearance of hydrogen and carbon monoxide in the feed. The total oxidation of methane to water and carbon dioxide occurred at lower temperature and did not affect the integral oxidation state.
X-ray transmission images using the CCD camera
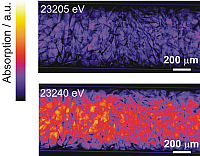
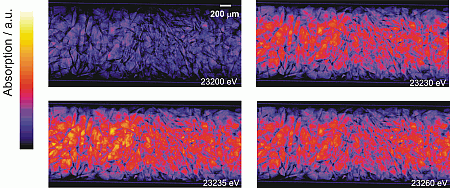
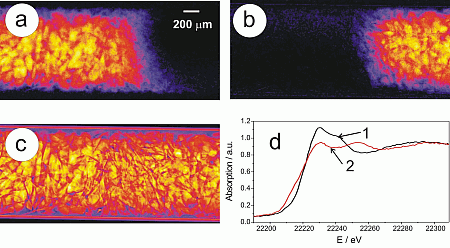
Figure 3 depicts the absorption for selected energies obtained from flat and dark-field corrected transmission images of the Rh/Al2O3 catalyst bed taken step by step at different energies (temperature at the outside of the capillary 283 °C, partial oxidation of methane to CO and H2 was detected by on-line gas analysis). At each energy, particles can be identified by their X-ray absorption. Below the energy of the Rh K-edge (< 23220 eV), the absorption is much smaller than above the edge (images at 23230, 23235, and 23260 eV). Moreover, the absorption is similar over the whole catalyst bed below the Rh K-edge, in contrast to the higher absorption above the Rh K-edge, in particular at 23235 and 23240 eV, where the left hand side of the reactor is more strongly absorbing than the right hand side (cf. Figure 3). Note that the gas was fed from the left for the whole experiment. The higher absorption on the left side of the reactor at 23235eV (Figure 3) is due to a higher concentration of oxidized Rh that has a pronounced whiteline at the given energy (cf. absorption difference at 23230 eV in Figure 2). This whiteline is not present on the right hand side, where the Rh is mainly reduced.
This can be even more clearly observed in the movie, given in Figure 4 (quicktime). In this movie, all the transmission images recorded step by step between 23190 and 23375 eV are depicted. Running this movie shows the absorption as function of energy (varied with time and given at the left top of each frame). The absorption increases (brighter pixels) above the Rh K-edge around 23220 eV. Then, the stronger absorption on the inlet side of the spectroscopic cell (left) and even the modulation of the absorption above the edge can be observed. Note also the high stability of the catalyst bed, only at the very end some particles at the outlet of the reactor moved, probably due to an instability in the exhaust system.
Reconstruction of the distribution of the oxidation state of Rh over the catalyst bed
The absorption as function of position in the reactor (x,y) and energy E is fully represented by the movie in Figure 4. Reconstructing the X-ray absorption spectra for every position in the sectional area of the reactor and fitting them by least squares to spectra of the reduced Rh-species, oxidized Rh particles (mainly Rh3+-species), and a linear background (featureless absorption by other elements), results in a 2D-map of the Rh-oxidation state distribution in the catalytic reactor, shown in Figure 5. Obviously, there is a steep gradient inside the catalytic reactor in the shape of a cone of reduced rhodium species towards the reactor inlet. Moreover, more reduced species are observed towards the top than towards the bottom of the reactor. The gradient occurs within 100 – 200 μm and is thus rather sharp. The gradient was strikingly stable for several hours and it only changed its position after a change in temperature or flow.
An interesting result is that the number of particles containing reduced Rh is highest in the axis of the reactor and that the cone points towards the inlet. This indicates that the reaction occurs faster in the middle of the reactor. Due to the exothermic reaction and the heat loss through the glass wall of the capillary, a radial temperature gradient from the centre to its outer parts is observed. The profile along the catalyst bed further supports the speculation that methane combustion at low temperature dominates in the first part of the reactor, whereas methane reforming occurs in the second part. Due to the fact that the catalyst is fully oxidized when the formation of hydrogen and CO disappears indicates that metallic Rh species are crucial for the reaction mechanism.
Structural information on a microscale is of interest in several areas, such as materials science, environmental science, electrocatalysis, and sensor technology. The presented approach is particularly advantageous if selection of sample regions using pre-mapping by XRF or other techniques is impossible or gradients are to be determined in a limited time interval such as encountered for in situ studies.
| References |
|
[1] Y. Iwasawa, X-ray absorption fine structure for catalysts and surfaces, Vol. 2, World Scientific, Singapore, (1996) |
| Contact information |
|
PD Dr. Jan-Dierk Grunwaldt (ETH Zurich) |
| Further Information |